Markets
Millennials are Investing With a Purpose, and It’s Changing Wealth Management
Millennials Investing With a Purpose
22% of Total AUM in U.S. are Sustainable Investments
The Chart of the Week is a weekly Visual Capitalist feature on Fridays.
If you’ve been paying attention to your social media feeds or most news outlets, it should be pretty clear to you that millennials seem to be “killing” just about everything – from Applebee’s to the entire golf industry.
While this “killing” meme is obviously a ridiculous hyperbole, there is at least some truth to it.
As the largest generation in American history, millennials are gaining sway and buying power quickly – and businesses that do not take heed to their preferences could feel the burn. Even worse, over the long run, some industries and businesses may go the way of the dodo.
The Rise of Sustainable Investing
The latest thing that millennials are “killing”? It’s the act of investing solely just for financial returns.
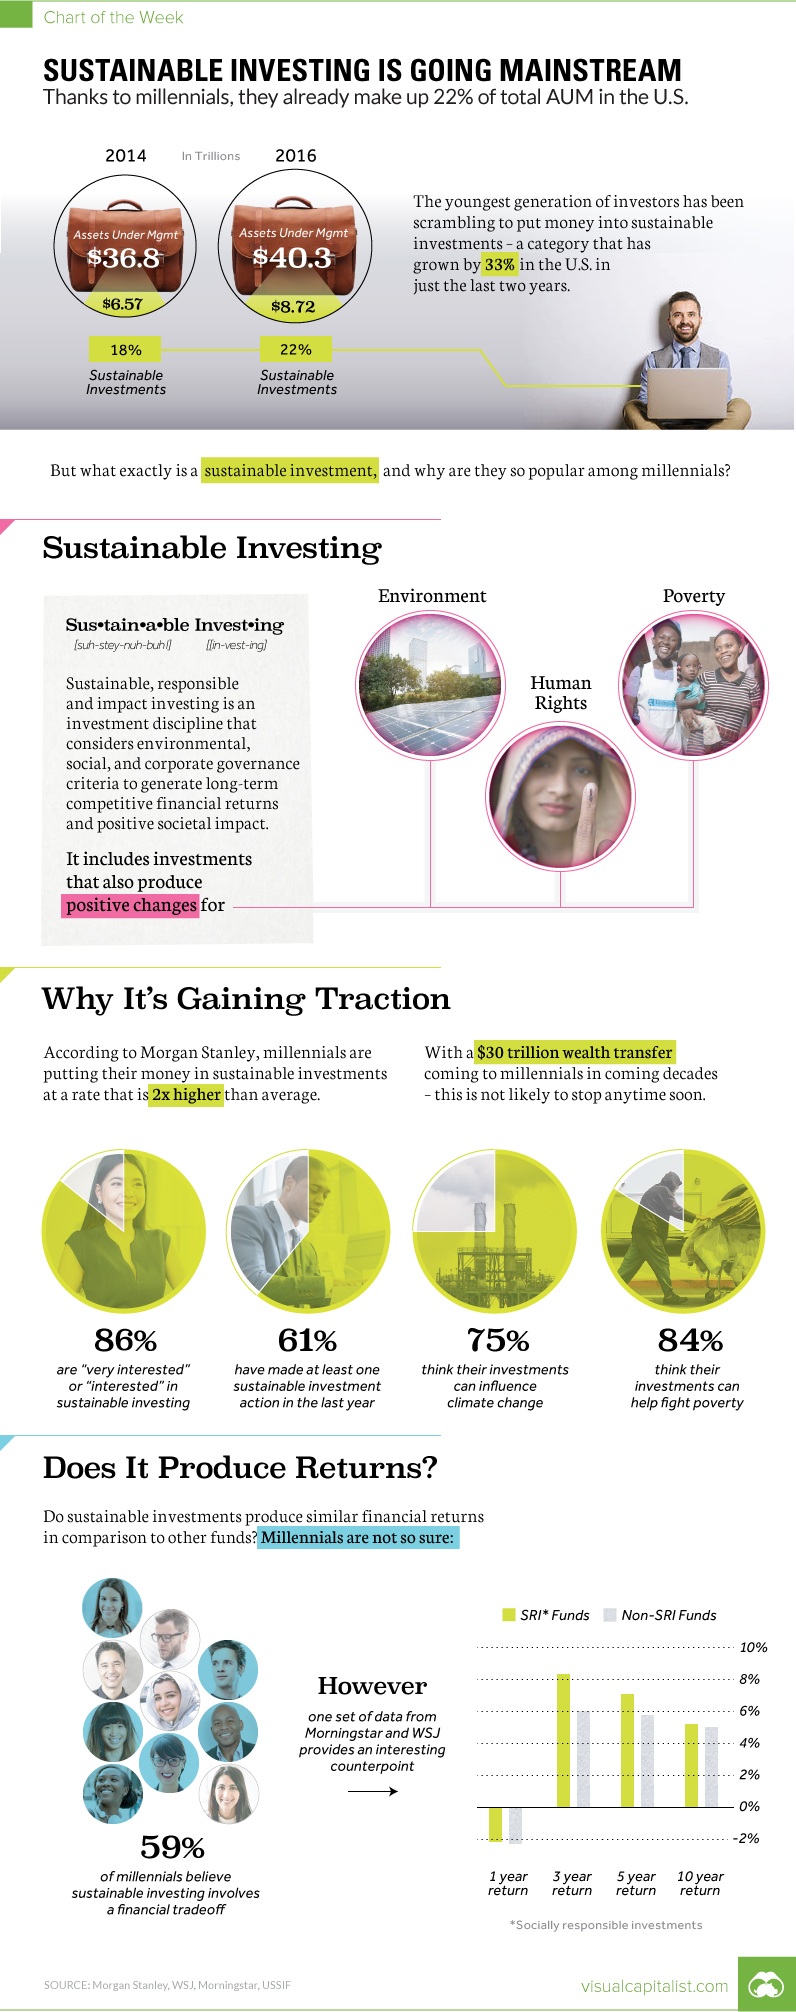
There’s mounting evidence that millennials are putting their money towards investments that have another component: making a positive societal impact. This practice is called sustainable investing, and it considers criteria around environmental, social, and corporate governance for investments in addition to the aspect of financial returns.
Put another way, many millennials want to put their money towards companies and funds that are helping to do things like alleviate poverty, protect the environment, or further human rights around the world. They want to generate ROI in both financial and social spheres.
Proof in the Pudding
Over the last decade or so, the amount of assets under management (AUM) for sustainable investments has ballooned to a whopping $8.72 trillion in the U.S. for 2016:
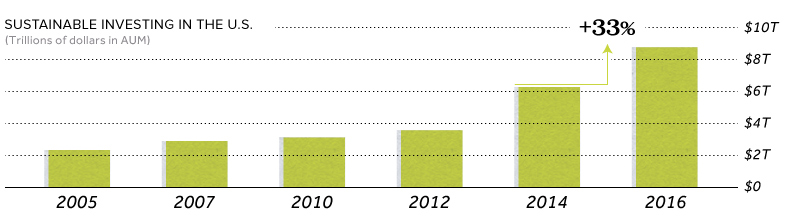
Since 2014, that’s a 33% increase – and even more interestingly, sustainable investments now make up 22% of the $40.3 trillion of total AUM in the United States.
Why is sustainable investing so popular among millennials? Here’s a rundown, mostly coming from recent research from Morgan Stanley:
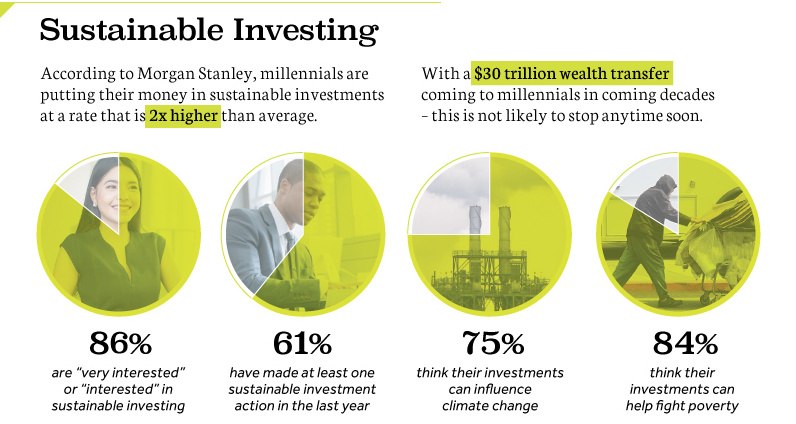
- Millennials are putting money in sustainable investments at a rate 2x higher than average.
- 86% of millennial investors say they are “very interested” or “interested” in sustainable investing.
- 61% have made at least one sustainable investment action in the last year.
- 75% think their investments can influence climate change.
- 84% think their investments can help fight poverty.
And with a $30 trillion wealth transfer coming to millennials over the coming decades, this preference of using investments as a vehicle for creating positive social change is more than just a trend.
The Big Question
There does remain one big question that millennials and wealth managers are focused on: do sustainable investments provide similar financial returns to regular investments?
Millennials are willing to take a risk that they don’t – in fact, Morgan Stanley found that 59% of millennials believe that there is a trade-off between social impact and financial returns.
Interestingly, some data is already providing a counterpoint to this narrative. In a report from Morningstar and WSJ, for example, it’s shown that funds focused on sustainable investments have offered superior performance to non-sustainable investments over periods of one, three, five, and 10 years.
Whether this stays true for the future remains to be seen – but it will be an important and fun metric to watch.


Markets
The European Stock Market: Attractive Valuations Offer Opportunities
On average, the European stock market has valuations that are nearly 50% lower than U.S. valuations. But how can you access the market?


European Stock Market: Attractive Valuations Offer Opportunities
Europe is known for some established brands, from L’Oréal to Louis Vuitton. However, the European stock market offers additional opportunities that may be lesser known.
The above infographic, sponsored by STOXX, outlines why investors may want to consider European stocks.
Attractive Valuations
Compared to most North American and Asian markets, European stocks offer lower or comparable valuations.
| Index | Price-to-Earnings Ratio | Price-to-Book Ratio |
|---|---|---|
| EURO STOXX 50 | 14.9 | 2.2 |
| STOXX Europe 600 | 14.4 | 2 |
| U.S. | 25.9 | 4.7 |
| Canada | 16.1 | 1.8 |
| Japan | 15.4 | 1.6 |
| Asia Pacific ex. China | 17.1 | 1.8 |
Data as of February 29, 2024. See graphic for full index names. Ratios based on trailing 12 month financials. The price to earnings ratio excludes companies with negative earnings.
On average, European valuations are nearly 50% lower than U.S. valuations, potentially offering an affordable entry point for investors.
Research also shows that lower price ratios have historically led to higher long-term returns.
Market Movements Not Closely Connected
Over the last decade, the European stock market had low-to-moderate correlation with North American and Asian equities.
The below chart shows correlations from February 2014 to February 2024. A value closer to zero indicates low correlation, while a value of one would indicate that two regions are moving in perfect unison.
| EURO STOXX 50 | STOXX EUROPE 600 | U.S. | Canada | Japan | Asia Pacific ex. China |
|
|---|---|---|---|---|---|---|
| EURO STOXX 50 | 1.00 | 0.97 | 0.55 | 0.67 | 0.24 | 0.43 |
| STOXX EUROPE 600 | 1.00 | 0.56 | 0.71 | 0.28 | 0.48 | |
| U.S. | 1.00 | 0.73 | 0.12 | 0.25 | ||
| Canada | 1.00 | 0.22 | 0.40 | |||
| Japan | 1.00 | 0.88 | ||||
| Asia Pacific ex. China | 1.00 |
Data is based on daily USD returns.
European equities had relatively independent market movements from North American and Asian markets. One contributing factor could be the differing sector weights in each market. For instance, technology makes up a quarter of the U.S. market, but health care and industrials dominate the broader European market.
Ultimately, European equities can enhance portfolio diversification and have the potential to mitigate risk for investors.
Tracking the Market
For investors interested in European equities, STOXX offers a variety of flagship indices:
| Index | Description | Market Cap |
|---|---|---|
| STOXX Europe 600 | Pan-regional, broad market | €10.5T |
| STOXX Developed Europe | Pan-regional, broad-market | €9.9T |
| STOXX Europe 600 ESG-X | Pan-regional, broad market, sustainability focus | €9.7T |
| STOXX Europe 50 | Pan-regional, blue-chip | €5.1T |
| EURO STOXX 50 | Eurozone, blue-chip | €3.5T |
Data is as of February 29, 2024. Market cap is free float, which represents the shares that are readily available for public trading on stock exchanges.
The EURO STOXX 50 tracks the Eurozone’s biggest and most traded companies. It also underlies one of the world’s largest ranges of ETFs and mutual funds. As of November 2023, there were €27.3 billion in ETFs and €23.5B in mutual fund assets under management tracking the index.
“For the past 25 years, the EURO STOXX 50 has served as an accurate, reliable and tradable representation of the Eurozone equity market.”
— Axel Lomholt, General Manager at STOXX
Partnering with STOXX to Track the European Stock Market
Are you interested in European equities? STOXX can be a valuable partner:
- Comprehensive, liquid and investable ecosystem
- European heritage, global reach
- Highly sophisticated customization capabilities
- Open architecture approach to using data
- Close partnerships with clients
- Part of ISS STOXX and Deutsche Börse Group
With a full suite of indices, STOXX can help you benchmark against the European stock market.
Learn how STOXX’s European indices offer liquid and effective market access.

-

 Economy2 days ago
Economic Growth Forecasts for G7 and BRICS Countries in 2024
The IMF has released its economic growth forecasts for 2024. How do the G7 and BRICS countries compare?
-

 Markets1 week ago
U.S. Debt Interest Payments Reach $1 Trillion
U.S. debt interest payments have surged past the $1 trillion dollar mark, amid high interest rates and an ever-expanding debt burden.
-

 United States2 weeks ago
Ranked: The Largest U.S. Corporations by Number of Employees
We visualized the top U.S. companies by employees, revealing the massive scale of retailers like Walmart, Target, and Home Depot.
-

 Markets2 weeks ago
The Top 10 States by Real GDP Growth in 2023
This graphic shows the states with the highest real GDP growth rate in 2023, largely propelled by the oil and gas boom.
-

 Markets2 weeks ago
Ranked: The World’s Top Flight Routes, by Revenue
In this graphic, we show the highest earning flight routes globally as air travel continued to rebound in 2023.
-

 Markets3 weeks ago
Ranked: The Most Valuable Housing Markets in America
The U.S. residential real estate market is worth a staggering $47.5 trillion. Here are the most valuable housing markets in the country.


-

 Education1 week ago
How Hard Is It to Get Into an Ivy League School?
-

 Technology2 weeks ago
Ranked: Semiconductor Companies by Industry Revenue Share
-
Markets2 weeks ago
Ranked: The World’s Top Flight Routes, by Revenue
-

 Demographics2 weeks ago
Population Projections: The World’s 6 Largest Countries in 2075
-
Markets2 weeks ago
The Top 10 States by Real GDP Growth in 2023
-

 Demographics2 weeks ago
The Smallest Gender Wage Gaps in OECD Countries
-

 Economy2 weeks ago
Where U.S. Inflation Hit the Hardest in March 2024
-

 Green2 weeks ago
Top Countries By Forest Growth Since 2001